|Creative Engineering
home page|
|Table of contents |
Learning HighRoad |
Using HighRoad|
Reference|
| Previous |
Next |
Chapter 21
Cross section survey
This chapter shows you how to use HighRoad if your survey data is
in the form of cross sections with offsets and levels. This method of
data collection is not commonly used but you may need it from time to
time. However, many HighRoad features available on a triangulated
ground model are not available for cross section data entry.
Cross
section data

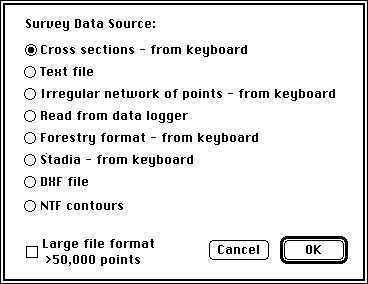
When you start HighRoad you can choose to start a new project
(New) or open an existing one (Open). If you select New to
start a new project a dialog box as shown in
Figure 21-1 will appear. Select Cross
sections - from keyboard. An empty Cross Section Data window will
appear on the screen. If you choose Open, a file selection dialog box
will appear on the screen. Select the required file. The survey data
will appear in the Cross Section Data window.
Figure
21-1
Note: When data is entered in cross section form
a digital terrain model (DTM) is not created. Many of the options are
not available for data entered in this form. If you need a terrain
model you can create a list of points from the cross section data
that you enter, and this can be used as the basis of a terrain
model.
Survey data in the form of cross sections is entered and
manipulated in the Cross Section Data window as shown in
Figure 21-2.
Figure 21-2
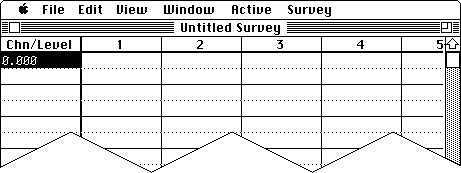
Rows and columns
The Cross Section Data window shows you part of the HighRoad
survey sheet, a rectangular grid of rows and columns representing
survey points on the ground.
The sheet is divided into pairs of rows. Each cross section is
represented by two rows and as many columns wide as necessary. The
first (left) column in the window is for entering chainages and
levels along the pegged line (often the road centre line). Offsets
and levels of points on the cross sections are entered into the other
(numbered) columns in the window. The chainage and all offsets belong
in the first row of each pair of rows and the levels are in the
second row of each pair.
The cell in the upper-left corner of Figure
21-2 is black, indicating that it is the active cell. This
represents the first chainage on the pegged line.
You can enter survey data in metres or feet. Metres are stored to
3 decimal places, feet to 2 decimal places. You can change from
metres to feet and vice versa by choosing Imperial or Metric from
Preferences in the Edit menu.
Entering data from the keyboard
The Cross Section Data window is set up to handle data entered in
the order of chainage and centre line level first, followed by offset
and level from left to right across the section. Press Enter after
each entry to move the active cell to the position of the next piece
of data. As the active cell reaches an edge of the window, the
columns or rows will scroll as necessary to keep the active cell in
view. Once you have entered all data for a particular cross section,
press Return and the active cell will move to the chainage cell of
the next cross section.
The use of the Enter and Return keys together with the numeric
keys is suited to keyboards with a numeric keypad. If your keyboard
does not have a numeric keypad you may find it useful to use the Tab
key instead of the Enter key after completing each data entry.
Reading data from a disk
Survey information is saved as part of a HighRoad project. To open
a project document from a disk, a window other than a Text File
window must be at the front.
Selecting cells and moving between cells
Click any cell on the grid to make it the active cell. It will
become black and you can place information in that cell by typing in
the data. Use the arrow keys, the Enter (Tab) or Return keys to move
the active cell. Press Enter to move the active cell through the
cross section to the right, and press Shift and Enter together to
move the active cell to the left. Press Return to move the active
cell to the chainage cell of the next cross section. Use the scroll
bars to view different parts of the survey sheet. You can edit the
data at any time and save the changes to the disk if required.
Changing the size of the survey sheet
The complete survey sheet is initially set to accommodate 10 cross
sections, with up to 20 points on each cross section. The number of
cross sections and points on each cross section can be changed to
suit your needs. The size of the Survey sheet is limited only by the
available memory of your computer. (Currently, the maximum length of
road that you can design is 32 km.)
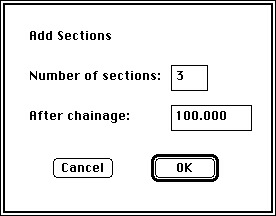
Adding and deleting cross sections
To add extra cross sections, choose Add Sections... from the
Survey menu. A dialog box will appear (see
Figure 21-3). Type the number of cross
sections to be added and the chainage after which you require the
cross sections to be added. Click the OK button and sufficient blank
space for the required number of sections will be added to the survey
sheet. In the example shown in Figure 21-3,
HighRoad will add space for three cross sections after chainage
100.000.
Figure 21-3
To delete cross sections from the survey, use the Add Sections...
command from the Survey menu. Type a negative number (instead of a
positive number) for the number of sections to be deleted. For
instance, to remove four rows after chainage 200.000, type in 4 and
200.000 in the appropriate places. HighRoad will warn you about the
deletion of survey data and give you the opportunity to cancel the
instruction.
Note: Make sure that there is always a blank
section at the end.
Adding extra columns
The Cross Section Data window is initially set to accommodate 20
columns for each cross section. This is sufficient for one column of
chainages and pegged-line levels and 19 pairs of offsets and levels.
You can add up to a total of 255 columns. To add columns, choose
Add columns... from the Survey menu. A dialog box will appear in
which you enter the required number of columns to be added.
Horizontal
alignment

Horizontal alignment information for survey data in the form of
pegged centre line and cross sections is entered and manipulated in
the Pegged Line Data window.
Rows and columns
The Pegged Line Data window (see Figure
21-4) shows you part of the HighRoad pegged line data. It is
rectangular grid of rows and columns representing information about
each element of the alignment. Each row represents either a straight
or curved element of the alignment.
Figure 21-4
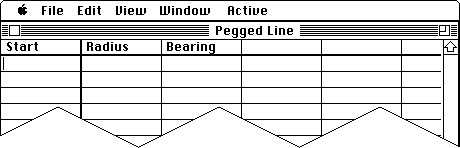
The first column represents the start chainage of the element.
Because pegged line data is stored and read in conjunction with the
cross section data, you must ensure that the start and finish
chainages of the pegged line data match the start and finish of the
cross section data. The second column represents the radius of the
element, the third represents the bearing at the start of the
element. The start and radius are displayed in the current units of
length (metres or feet), and the bearing is displayed in the current
units of angular measurement. To change units choose Preferences from
the Edit menu. The cell in the upper-left corner of
Figure 21-4 has a blinking insertion point
indicating that it is the active cell. This represents the first
chainage on the pegged line.
Entering data from the keyboard
The Pegged Line Data window is set up to accept data entered in
order from left to right across each row. After typing in the data
for each cell, move to the next cell by using the Enter key. In the
case of a straight, the radius does not apply (in strict mathematical
terms it is infinity). HighRoad, however, interprets a radius of zero
to represent a straight line. Where a radius of zero has been
entered, HighRoad will display the word straight.
To type in a bearing in the form of degrees, minutes and seconds,
such as 30° 26' 37", use the shift and option keys to display
the symbols. The degree symbol is displayed by holding down the shift
and option keys and pressing 8. Use the shift key to display the
seconds symbol. Alternatively you can type in the figures without the
symbols and HighRoad will insert the correct symbols for you. To
enter 30° 26' 37" type 302637 and press Enter. You must make
sure that you enter 2 digits for both minutes and seconds. For
example:
Angle Type as
136° 2' 32" 1360232
30° 300000
3° 5' 6" 30506
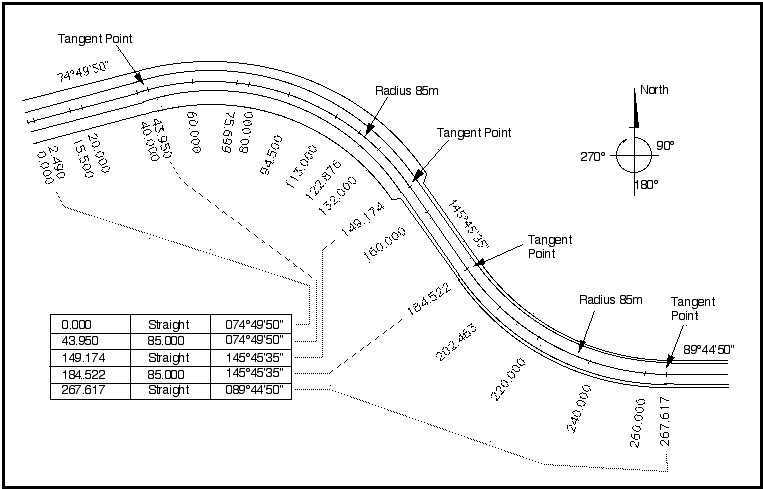
An example of a road alignment and the data as it is entered in
the Pegged Line Data window is shown in Figure
21-5.
Adding extra rows
When you complete the data for each row, press return or enter, or
click on a cell in the next row to move to the next row. You must
complete each row before moving to the next -- you cannot leave
blank rows in the table of pegged line data. If you attempt to move
to a blank row two or more rows from the last complete entry, the
active cell will not move there. The number of elements that can be
added is limited only by the memory available in your computer.
Figure 21-5
Accuracy of data
HighRoad does not check the data that you enter. You must carry
out your own checks to ensure that the data is correct. Incorrect
data may show up in the form of discontinuities in the plan view
displayed in the Plan window.
Plan view

In order to display the plan view you must have entered a cross
section survey and designed a typical section and profile. (See
Chapter 7, Typical sections and
Chapter 8, Profile for details.)
Until you have completed these tasks, Plan in the Window menu will be
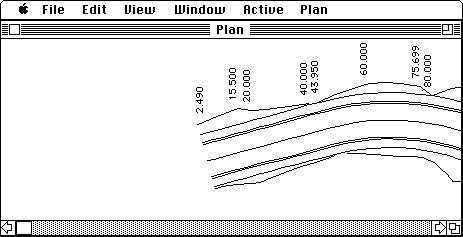
dimmed. The Plan window as it first appears on the screen is shown in
Figure 21-6. Initially the start of the road
is in the centre of the window. Drag the scroll box and a box
displaying the chainage will appear in the centre of the screen.
Scroll to the chainage you wish to view. The orientation of the road
is altered so that the chainage of interest is at the centre of the
screen and aligned horizontally. You can change the scale of the plan
view by choosing the appropriate scale from the View menu. The
information used to draw the plan is based on the current survey,
typical section and profile data. Changes made to any of these will
be reflected in the plan view when it is redrawn.
Figure 21-6
The plan will be printed on series of sheets which can be pasted
together to form a strip map. You can select the scale from the
Layout menu. There will be a slight overlap between sheets so that
they can be easily pasted together. The section of road to be printed
on each sheet is aligned so that it is horizontal on the sheet. To
fit the most information on each sheet of paper, choose landscape
orientation from the standard page setup dialog box.
Limitations
You can now use HighRoad to view cross sections, calculate
quantities, print, plot and export data. Remember because some of the
options are not available for data entered in cross section form some
of the dialog boxes which appear on the screen may be different to
what is shown in the manual.
Note: When specifying Quantities limits (see
chapter 14) the
quantities are calculated and printed between the surveyed sections
nearest to the limits you enter. The surveyed cross sections are used
for end area calculations. Similarly when viewing cross sections, the
previous or next cross section will be at the next or previous
surveyed cross section. When viewing cross sections along the
profile, some of the sections may not fall on surveyed sections, in
which case the ground levels and offsets will be interpolated.
Interpolated sections will be shown with the natural surface as a
dotted line.
The following HighRoad features available on a triangulated ground
model are not available for a project created using cross section
data entry:
* Building
pads
* Transitions
* Cul-de-sacs
* Intersections
* Perspective
views
* Drawing
production
Converting
survey data to a DTM

If you need a terrain model you can create a list of points from
the cross section data that you enter, and this can be used as the
basis of a terrain model.
Converting from
cross section data to a DTM format
Data in the form of pegged centre line and cross sections does not
initially create a digital terrain model. A profile along the centre
line is drawn and cross sections are displayed at surveyed sections
or interpolated between sections. You can convert from cross section
data to a DTM format. To do so you need to have entered cross section
data and pegged line data for the job. (Information about entering
pegged line data is discussed in
Horizontal
alignment, above.) Display the Text window and choose List
Points... from the Text menu. The points which make up the cross
section data will be listed in the following form:
Point# Northing Easting Elevation Comment
Points which are on the pegged centre line will have the comment
PLine attached. Save the text file and quit HighRoad. You can now
start HighRoad again, choose New and open the text file that you just
created. Follow the normal procedure for conversion of a text file
into a terrain model.
When converting from cross sections to a DTM we recommend that you
create two dummy cross sections one just before the start and one
just past the end so that the terrain model extends past the ends of
the proposed road. These should be the same as the original first and
last cross sections respectively. You should do this because any
control lines you add must be entirely within the terrain model. This
will allow a buffer area at the start and end so that you can adjust
the location of the control line.
During the conversion process you will be asked whether you wish
to add PLine to the library. We suggest you do so and make a feature
called Pegged Line. This feature should be contourable, with points
joined and marked with a symbol such as a triangle. The Pegged Line
box should be checked. This can be used to make sure that cross
sections are shown at the locations of the pegged points.
| Previous |
Next |