|Creative Engineering
home page|
|Table of contents |
Learning HighRoad |
Using HighRoad|
Reference|
| Previous |
Next |
Chapter 20
Exporting information
This chapter shows you how to transfer drawings and
data created by HighRoad into other applications. You will learn how
to make PICT and DXF files of drawings, list survey points and
quantities in a text file, export the terrain model in Quickdraw 3D,
GDL and CivilCAD format and export roads or pads in MOSS format.
PICT
files

Note: PICT files are used mainly by Macintosh
users.
Saving drawings as PICT files
You can save drawings of plan, profile, and cross sections as PICT
files. Any application that can accept PICT files can read the file
and reproduce these drawings. You can then enhance these drawings
within that application by adding notes and diagrams. You set up for
PICT files in the same manner as you do when producing drawings on a
plotter.
Exporting the plan
The plan can be exported when the Plan window is active. (Choose
Plan from the Window menu.) Contours, triangles and feature strings
may be shown in addition to the plan of the road when survey data is
an irregular network of points.
Figure
20-1
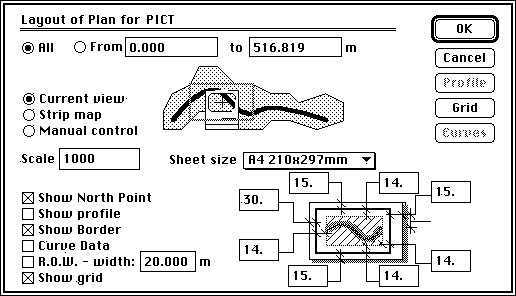
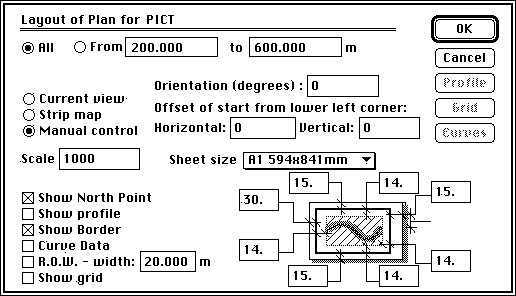
Choose Show contours, Show triangulation, Show features as
required from the Plan menu. Select Export Plan as PICT... from the
File menu. The dialog box as shown in Figure
20-1 will appear. You can choose to show a north point, border,
curve data, grid and right of way on the plan.
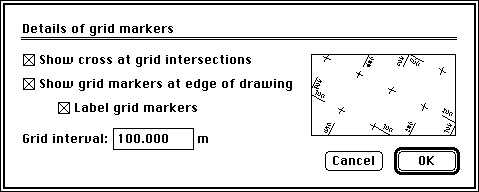
When the Grid option is checked, the Grid button will be active.
Click the Grid button. A dialog box, as shown in
Figure 20-2 will appear and you can specify
the spacing and labelling of the co-ordinate grid system. The grid
can be shown using crosses at grid intersections and/or where the
grid lines cross the edge of the drawings. The grid markers can be
labelled.
Figure 20-2
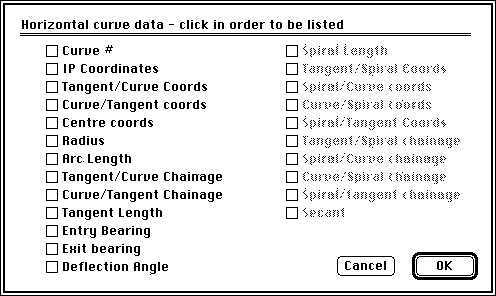
When the Curve Data option is checked, the Curve Data button will
be active. Click the Curve Data button and the plan layout dialog box
as shown in Figure 20-3 will appear. You
can select the horizontal curve data (radius, arc length, spiral
length, co-ordinates etc) which will be listed on Plan view. Items
are listed in the order you choose and a box is drawn around these
items.
When the Right of Way (R.O.W.) option is checked, the R.O.W. will
be drawn on the plan. The R.O.W. width that you specify will only be
used if it is larger than the width between the batters plus 3
metres. If not HighRoad will use the width between the batters plus 3
metres.
Figure 20-3
The Current View option (shown in
Figure 20-1 previously) will position the
plan on the drawing sheet such that the point which is in the centre
of the screen will be in the centre of the drawing. It will be
clipped according to the margin settings that you select.
The Strip Map option (as shown in Figure
20-4) will rotate the plan view so that it is generally running
from left to right across the sheet. When the Strip Map option is
chosen you can also plot the profile along the bottom of the drawing.
Figure 20-4
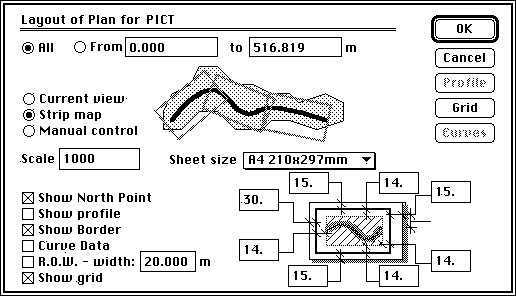
When Show Profile is checked, the profile button is enabled and
the diagram in the lower right of the dialog box shows the plan and
profile and the proportion occupied by the plan. You can nominate the
proportion of the drawing occupied by the plan. To set the options
for the profile, click the Profile button. A dialog box as shown in
Figure 20-6 will appear. Click OK or Cancel
and HighRoad will return to the Plan layout dialog box. As many
sheets as required will be used to produce the drawings.
The Manual control option (see Figure
20-5) allows you to choose the scale and orientation of the
drawing. Orientation is the direction of the north point on the sheet
zero is north up, 90 is north to the right, and so on. The plan will
be rotated about the start point.
Figure 20-5
Click OK when you have selected the required layout. As each sheet
of your drawing is about to be created as a PICT file a standard
dialog box, in which you can name the file, will appear.
Note: The creation of a plan view can be a very
time consuming process depending on the complexity of the plan, and
the type of computer being used.
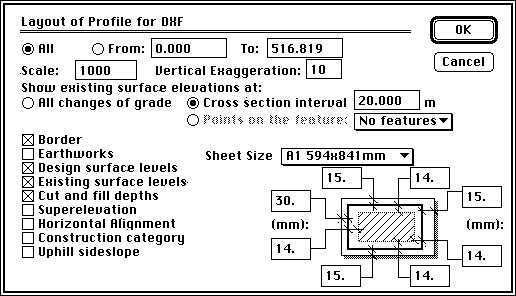
Exporting the profile
The profile can be exported when the Profile window is the front
window. Choose Export Profile as PICT... from the File menu. A dialog
box as shown in Figure 20-6 will appear.
You can select the scale, vertical exaggeration, drawing size, format
and how to display the natural surface information.
Figure 20-6

Frequently the natural surface information on the
drawing of the profile can be very cluttered if the elevation at
every change of grade is displayed. In this case you can minimise
this clutter by limiting the number of points which have an elevation
displayed. You can choose to show elevations only at the cross
section interval or only opposite points on a particular feature.
This would be useful if you have a pegged line which closely
parallels the control line and you wish to display elevations at
chainages opposite points on this pegged line. The pegged line has to
be a pegged line feature which you can then choose from the pop-up
menu in the dialog box as shown in Figure
20-6.
Uphill sideslope will include an entry for slope on the uphill
side of the cross section, from the natural surface at road centre
line to the natural surface at the batter point. The Superelevation
option is available only if superelevation has been specified for
this control line. If selected a superelevation diagram will be
plotted along the base of the profile. The Horizontal Alignment
option will display a diagrammatic representation of the horizontal
alignment along the base of the profile. The Cut and fill depths
option will include an entry for the cut depth or fill height at the
control line.
Exporting cross
sections
Cross sections can be exported when the Cross Section plot window
is the front window. To specify the layout of the cross sections,
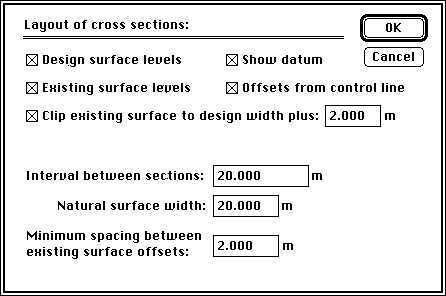
choose Layout... from the Section menu. A dialog box will appear as
shown in Figure 20-7.
The top four check boxes are used to select how much information
is to be displayed on each cross section. In this example, the cross
sections would include the natural surface levels, the finished
surface levels, the offsets to these points and the level of the
datum line.
Figure 20-7
The option to clip the width of the existing surface is useful to
minimise the space taken up on plotted and printed drawings by
showing only the natural surface within the design width. Any part of
the natural surface outside the limits of the batter points is
removed. Space savings can be worthwhile when the surveyed cross
sections are significantly wider than the width of the finished
surface. The option for setting the minimum spacing between natural
surface offsets is useful to minimise clutter on a cross section
drawing. Set this to zero if you wish to display the offset and
elevation at every change of grade on the existing surface.
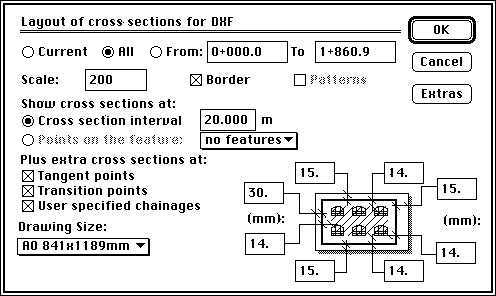
You can export cross sections in sequence or individually at
specific chainages. Choose Export Cross Sections as PICT...
from the File menu. A dialog box, as shown in
Figure 20-8 will appear. Enter the chainage
range of the cross sections you wish to export in the appropriate
boxes. You can also specify the spacing between sections. The
interval between printed cross sections can be either at a nominated
interval or at locations opposite points on a pegged line.
Figure
20-8

To export cross sections at points on a pegged line
you need to have nominated the pegged line as a feature string of
type Pegged line (see page
Chapter 4). The pegged
line must also be approximately parallel to the control line. The
cross sections that will be plotted are those that pass through the
nominated points on the pegged line feature. Additional cross
sections at tangent points, transition points and at user selected
chainages can also be plotted. Sections at tangent points will have
the postscript TC (tangent/curve) and CT (curve/tangent) and those at
transition points will have TS (tangent/spiral), SC (spiral/curve),
CS (curve/spiral), ST (spiral/tangent), SS (start of superelevation)
and ES (end of superelevation). If User specified chainages is
checked, the Extras button will be enabled. Click Extras and you can
add up to 49 extra cross sections. Type in the chainages of the extra
cross sections that you require. The extra sections will be added to
the PICT file in the correct sequence. You can also specify whether
you require the pavements and other surfaces to be filled with a
pattern on the plots of the cross section.
The cross sections will be spaced out to fit as many as possible
on the drawing. They will be plotted in columns with their centre
lines aligned and spaced evenly to utilise the vertical space
available. The columns of cross sections will also be spaced evenly
across the sheet. The Clip to Design option (see
Cross section
layout) is useful to minimise the space taken up on plotted
drawings by showing only the natural surface within the design width.
Any part of the natural surface outside the limits of the batter
points is not shown. Significant space savings are achieved in
projects where the surveyed cross sections are much wider than the
width of the finished surface. Choose Cross Sections... from the
Layout menu to use this option.
You can choose to plot a border around the sheet by clicking the
Border check box. Space for a title block at the bottom or side of
the sheet can be allowed for by nominating an appropriate margin
size. This is useful when using sheets preprinted with standard title
blocks. As each drawing is about to be created as a PICT file a
standard dialog box, in which you can name the file, will appear.
Exporting drawing as PICT
When the Drawing window is active you can export the current
drawing as a PICT file.
DXF
files
 Drawings can also be transferred to
other CAD programs using DXF files. These are AutoCAD exchange format
and can be read by many CAD programs. You can save drawings of plan,
profile, and cross sections as DXF files. Any application that can
accept DXF files can read the file and reproduce these drawings. You
can then enhance these drawings within that application by adding
notes and diagrams. DXF files can be used in CAD programs.
Drawings can also be transferred to
other CAD programs using DXF files. These are AutoCAD exchange format
and can be read by many CAD programs. You can save drawings of plan,
profile, and cross sections as DXF files. Any application that can
accept DXF files can read the file and reproduce these drawings. You
can then enhance these drawings within that application by adding
notes and diagrams. DXF files can be used in CAD programs.
Exporting the plan
The plan can be exported when the Plan window is active. (Choose
Plan from the Window menu.) Contours, triangles and feature strings
may be shown in addition to the plan of the road when survey data is
an irregular network of points. Choose Show contours, Show
triangulation, Show features as required from the Plan menu. Select
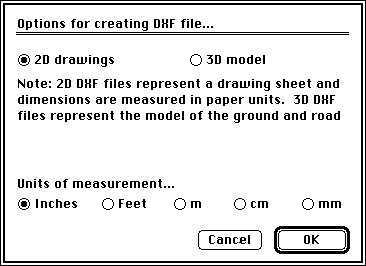
Export Plan as DXF... from the File menu. A dialog box as shown in
Figure 20-9 will appear. You can choose to
export the plan as a 2D or 3D DXF file, and which units of
measurement you want to use for the DXF file. DXF files representing
drawings are measured in paper units, and DXF files representing the
model of the ground and construction work are measured in real world
units.
Figure 20-9
2D DXF
Choose 2D if you wish to export the plan formatted for a drawing
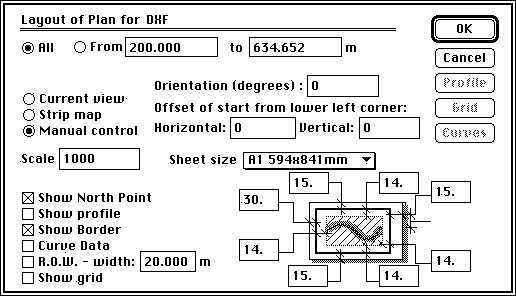
sheet. Click 2D and the dialog box as shown in
Figure 20-10 will appear. You can choose
what information you wish to include in the drawings that will be
exported. You can choose to show a north point, border, curve data,
grid and right of way on the plan.
Figure
20-10

When the Grid option is checked, the Grid button will be active.
Click the Grid button. A dialog box, as shown in
Figure 20-11 will appear and you can
specify the spacing and labelling of the co-ordinate grid system. The
grid can be shown using crosses at grid intersections and/or where
the grid lines cross the edge of the drawings. The grid markers can
be labelled.
Figure
20-11

When the Curve Data option is checked, the Curve Data button will
be active. Click the Curve Data button and the plan layout dialog
box, as shown in Figure 20-12, will appear.
You can select the horizontal curve data (radius, arc length, spiral
length, co-ordinates etc) which will be listed on Plan view. Items
are listed in the order you choose and a box is drawn around these
items.
Figure
20-12

When the Right of Way (R.O.W.) option is checked, the R.O.W. will
be drawn on the plan. The R.O.W. width that you specify will only be
used if it is larger than the width between the batters plus 3
metres. If not HighRoad will use the width between the batters plus 3
metres.
The Current View option (shown in Figure
20-10 previously) will position the plan on the drawing sheet
such that the point which is in the centre of the screen will be in
the centre of the drawing. It will be clipped according to the margin
settings that you select.
The Strip Map option (shown in Figure
20-13) will rotate the plan view so that it is generally running
from left to right across the sheet. When the Strip Map option is
chosen you can also plot the profile along the bottom of the drawing.
When Show Profile is checked, the profile button is enabled and the
diagram in the lower right of the dialog box shows the plan and
profile and the proportion occupied by the plan. You can nominate the
proportion of the drawing occupied by the plan. To set the options
for the profile, click the Profile button. A dialog box as shown in
Figure 20-15 will appear. Click OK or
Cancel and HighRoad will return to the Plan layout dialog box. As
many sheets as required will be used to produce the drawings.
Figure 20-13

The Manual control option (see Figure
20-14) allows you to choose the scale and orientation of the
plot. Orientation is the direction of the north point on the sheet
zero is north up, 90 is north to the right, and so on. The plan will
be rotated about the start point.
Figure
20-14
Click OK when you have selected the required layout. As each sheet
of your drawing is about to be created as a DXF file a standard
dialog box, in which you can name the file, will appear.
Note: The creation of a plan view can be a very
time consuming process depending on the complexity of the plan and
the type of computer being used.
3D DXF
Choose 3D if you wish to export a plan of the entire project in
three dimensions. Triangles and roads can be exported as a 3D DXF
file. This option is useful when exporting terrain data to other
software for visualisation. Any, all or none of triangles and roads
will be exported depending on which of these is displayed in the Plan
view when you choose Export Plan in DXF format.
The DXF file will be created with the following layers:
BASE
POINTS
TRIANGULATION
CONTOURS
MAJOR CONTOURS
FEATURES
ROAD
MISC
LIMITS.
If roads are exported, surface names as defined in the typical
section window will be added. For example:
PAVEMENT
KERB & GUTTER
Note: Only the first 12 characters of surface
names are used for DXF layer names.
If the road is shown as transparent, the contours will be
continuous across the road construction zone. If the road is not
transparent, the contours will not be drawn across the road. The
layer LIMITS includes polygons which can be used as white filled
areas to blank out the background behind the road. Contours will be
created as polylines.
Exporting the profile
The profile can be exported when the Profile window is the front
window. Choose Export Profile as DXF... from the File menu. A dialog
box as shown in Figure 20-15 will appear.
You can select the scale, vertical exaggeration, drawing size, format
and how to display the natural surface information.
Frequently the natural surface information on the drawing of the
profile can be very cluttered if the elevation at every change of
grade is displayed. You can minimise this clutter by limiting the
number of points which have an elevation displayed. You can choose to
show elevations only at the cross section interval or only opposite
points on a particular feature. This would be useful if you have a
pegged line which closely parallels the control line and you wish to
display elevations at chainages opposite points on this pegged line.
The pegged line has to be a pegged line feature which you can then
choose from the pop-up menu in the dialog box as shown in
Figure 20-15.
Figure 20-15
Uphill sideslope will include an entry for slope on
the uphill side of the cross section, from the natural surface at
road centre line to the natural surface at the batter point.
The Superelevation option is available if superelevation has been
specified for this control line. If selected a superelevation diagram
will be plotted along the base of the profile. The Horizontal
Alignment option will display a diagrammatic representation of the
horizontal alignment along the base of the profile. The Cut and fill
depths option will include an entry for the cut depth or fill height
at the control line.
Click OK when you have selected the required layout. The profile
will be split into lengths which fit the drawing sizes chosen. As
each sheet of your drawing is about to be created as a DXF file a
standard dialog box, in which you can name the file, will appear.
Exporting cross sections
Cross sections can be exported when the Cross Section plot window
is the front window. To specify the layout of the cross sections,
choose Layout... from the Section menu. A dialog box will appear as
shown in Figure 20-16. The top four check
boxes are used to select the information to be displayed on each
cross section. In this example, the cross sections would include the
natural surface levels, the finished surface levels, the offsets to
these points and the level of the datum line.
Figure
20-16

The option to clip the width of the existing surface is useful to
minimise the space taken up on plotted and printed drawings by
showing only the natural surface within the design width. Any part of
the natural surface outside the limits of the batter points is
removed. Space savings can be worthwhile when the surveyed cross
sections are significantly wider than the width of the finished
surface. The option for setting the minimum spacing between natural
surface offsets is useful to minimise clutter on a cross section
drawing. Set this to zero if you wish to display the offset and
elevation at every change of grade on the existing surface.
You can export cross sections in sequence or individually at
specific chainages. Choose Export Cross Sections in DXF
format... from the File menu when you are ready to export the cross
sections. A dialog box, as shown in Figure
20-17, will appear.
Figure
20-17
Enter the chainage range of the cross sections you wish to export
in the appropriate boxes. You can also specify the spacing between
sections. The interval between printed cross sections can be either
at a nominated interval or at locations opposite points on a pegged
line.
To export cross sections at points on a pegged line you need to
have nominated the pegged line as a feature string of type Pegged
line (see Chapter 4).
The pegged line must also be approximately parallel to the control
line. The cross sections that will be plotted are those that pass
through the nominated points on the pegged line feature.
Additional cross sections at tangent points, transition points and
at user selected chainages can also be plotted. Sections at tangent
points will have the postscript TC (tangent/curve) and CT
(curve/tangent) and those at transition points will have TS
(tangent/spiral), SC (spiral/curve), CS (curve/spiral), ST
(spiral/tangent), SS (start of superelevation) and ES (end of
superelevation). If User specified chainages is checked, the Extras
button will be enabled. Click Extras and you can add up to 49 extra
cross sections. Type in the chainages of the extra cross sections
that you require. The extra sections will be added to the DXF file in
the correct sequence.
The cross sections will be spaced out to fit as many as possible
on the drawing. They will be plotted in columns with their centre
lines aligned and spaced evenly to utilise the vertical space
available. The columns of cross sections will also be spaced evenly
across the sheet. The
Clip to Design
option is useful to minimise the space taken up on plotted drawings
by showing only the natural surface within the design width. Any part
of the natural surface outside the limits of the batter points is not
shown. Significant space savings are achieved in projects where the
surveyed cross sections are much wider than the width of the finished
surface. Choose Cross Sections... from the Layout menu to use this
option.
You can choose to plot a border around the sheet by clicking the
Border check box. Space for a title block at the bottom or side of
the sheet can be allowed for by nominating an appropriate margin
size. This is useful when using sheets preprinted with standard title
blocks or when using title blocks created in the CAD program. As each
drawing is about to be created as a DXF file a standard dialog box,
in which you can name the file, will appear.
CivilCAD ASCII
files

You can export the terrain model (not the roads) in CivilCAD
format. Bring the text window to the front. Choose List in CivilCAD
ASCII format.
Note: If you construct the roads so that they
become part of the terrain, road information can be exported for use
in CivilCAD.
The points and feature strings will be listed as a CivilCAD ASCII
file. Non contourable points will be listed with an elevation of
-10000. Each feature type will be on a separate layer -- there could
be more than one feature on a layer. The names of features often have
to be changed and/or truncated to conform to the limitations of
CivilCAD layer names. The names will be converted to upper case and
spaces will be converted to an underscore. Names will be truncated to
a maximum of 5 characters. This may cause naming clashes if there is
more than one feature with the first 5 characters the same. If so,
they are reduced to 3 characters and 2 digits from 00 to 99 are added
to differentiate between them. Symbols are converted to the
equivalent CivilCAD symbol where possible.
MOSS files

You can export each control line as a MOSS GENIO file. If the road
is displayed in plan view as a control line only, then only the
control line will be exported. If all of the road is displayed, then
all the links will be exported. The control line will be exported as
a MOSS 6 dimensional string. The 6 dimensional co-ordinate groups
will be spaced at the cross section interval currently in force. The
six dimensions exported for each point are: easting, northing,
elevation, chainage, bearing and radius. Straights are listed as
radius 999,999.9 metres. The control line string will be named MR
followed by the control line number. (For example, control line 12
will be named MR12.)
Link edges, such as the pavement edge, and outer reference points
of edges such as kerbs are exported as MOSS three dimensional
strings. The three dimensions exported are easting, northing and
elevation. Some link edges may be discontinuous. For example, a drain
in a cutting is only applicable when the road is in a cutting. As the
road changes from cut to fill over its length, the drain stops and
starts. Such link edges are created as a MOSS string with
discontinuities.
MOSS three dimensional strings are named according to a code you
nominate, the control line they are attached to, which side of centre
line they are on, and a string number. See
MOSS strings. The file
name suggested by HighRoad will be the name of the control line
followed by the suffix .MOS. You may have to rename this to suit the
operating system that the MOSS file will be used on.
Listing points and
observations

You can list the points of a terrain model in a text file. Choose
Text from the Window menu. If there is not a text file open, an empty
document will appear on the screen. If a text file is already open,
it will become the active window. If you do not wish to add the
points information to this text file, choose New text file from the
File menu. An empty document will appear.
Choose List points... from the Text menu. A dialog box which
allows you to choose the information you wish to list about the
points will appear on the screen. You can choose to list the point
number, its northing, easting and elevation and comments about the
point.
Click OK. All the points will be listed in the Text window. You
can save this file and open it with other applications that read text
files such as spreadsheets and word processors.
You can also list observations when the data is read from a data
logger. This option is only available immediately after you have
converted the data. If you change jobs or quit this information is
not stored. Choose Text from the Window menu. If there is not a text
file open, an empty document will appear on the screen. If a text
file is already open, it will become the active window. If you don't
wish to add these observations to this text file, choose New text
file from the File menu. An empty document will appear.
Choose List Observations from the Text menu. All the observations
will be listed in the Text window. You can save this file and open it
with other applications that read text files such as spreadsheets and
word processors.
Note: When listing in a text file hundreds and
thousands separators are not shown. This is done to avoid problems
that have been evident when reading text files with separators into
various spreadsheets (the numbers were not recognised as a number
when separators were present.)
Listing
quantities

You can list the earthworks quantities for either roads or
building pads in a text file. Choose Text from the Window menu. If
there is not a text file open, an empty document will appear on the
screen. If a text file is already open, it will become the active
window. If you do not wish to add the quantities information to this
text file, choose New text file from the File menu. An empty document
will appear.
For building pads, choose List Quantities from the Text menu.
For roads, make sure that you have selected the required
quantities limits, strip depth, earthworks factor (i.e. compaction or
bulking) and method of calculation. You can choose these items from
the Text menu. Choose List Quantities from the Text menu. A dialog
box which allows you to choose the information you wish to list about
the quantities will appear on the screen. You can choose to list the
cut end area, fill end area, cut volume, fill volume, strip volume
and strip area. If a second strata exists then you can also choose to
list the cut area and cut volume of this second strata.
If the second strata is marked For earthworks monitoring the
quantities will be listed in two sections, one for work done, the
other for work not yet complete.
You can save this text file and open it with other applications
that read text files such as spreadsheets and word processors.
Note: To take account of intersecting control
lines when calculating quantities or batter slopes, one or more
control lines may have to be constructed.
Listing setout

You can list the setout information in a text file. Choose Text
from the Window menu. If there is not a text file open, an empty
document will appear on the screen. If a text file is already open,
it will appear on the screen. If you do not wish to add the setout
information to this text file, choose New from the File menu. An
empty document will appear.
Figure
20-18
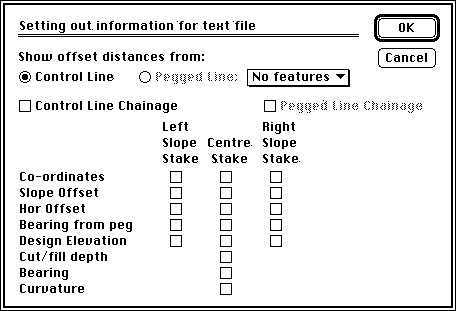
Choose List setout... from the Text window. A dialog box will
appear as shown in Figure 20-18. From
Pegged line will be greyed out and not available if there are no
pegged line features. Any pegged line features will be listed
in the pop-up menu. (To specify a feature as a pegged line,
double-click a point on the feature, and click the Feature button,
this will show the details of this feature make sure the Pegged Line
box is checked). Chainages along the pegged line will be listed when
the Pegged line box is checked.
The List setout... command will list the northings and eastings at
chainages along the current control line. HighRoad will list setting
out information at regular intervals along the control line or
opposite points on the pegged line. If offsets are to be from the
pegged line, setting out information will be listed for each point on
the pegged line. If offsets are to be from the control line, setting
out information will be listed at the cross section interval.
Listing
horizontal alignment

You can list the horizontal alignment details for the current
control line in a text file. Choose Text from the Window menu. If
there is not a text file open, an empty document will appear on the
screen. If a text file is already open, it will appear on the screen.
If you do not wish to add the setout information to this text file,
choose New from the File menu. An empty document will appear.
Figure
20-19

Choose List Horizontal Alignment... from the Text menu. You can
select which items should be listed for each curve from the dialog
box (see Figure 20-19) that appears. The
order in which you list them will be the order in which they are
listed. A number appears beside each box to show the currently
selected order. The items on the right side only apply to plan
transitions and are only active if plan transitions are used on the
active control line.
GDL files

You can export the terrain model in GDL format. (ArchiCAD uses GDL
files.) Choose Save terrain as GDL file... You will be asked to name
the file. HighRoad will create a text file containing a GDL 3D
script.
Figure
20-20
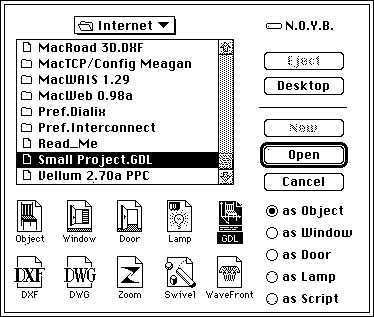
This will include the triangles that make up the terrain model. If
the terrain has been changed by constructing any roads, this is the
terrain that will be exported as triangles. To use this file in
ArchiCAD, choose Open Library Part and select GDL and as Object as
shown in the dialog box in Figure 20-20.
Select the GDL file from HighRoad and click Open.
Figure
20-21
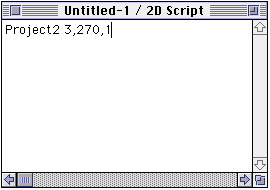
Once the conversion has been done, and the new untitled library
part is open, go to the 2D Script window and type PROJECT2 3,270,1 as
shown in Figure 20-21. Save and place on
FloorPlan.
Quickdraw 3D
files

You can export the terrain model in Quickdraw 3D metafile format
(QDMF). Choose Save terrain as Quickdraw 3D file... You will be asked
to name the file. HighRoad will create a text file containing
Quickdraw 3D objects. This will include the triangles that make up
the terrain model. If the terrain has been changed by constructing
any roads, this is the terrain that will be exported as triangles. If
roads are constructed the triangles will be coloured according to the
link types that make up the road.
Exporting points to a
data logger

If your data logger is not already connected, turn off the
computer and connect your data logger to the communications serial
port of your computer. For computers that do not have a serial port,
refer to the note
regarding serial ports.
Preparing points for uploading to a data logger
To prepare points for upload to a data logger the Plan window must
be the active window. Select the points you want to uploadby drawing
a rectangle around the points. You can add or delete points from the
selection by clicking on the points while holding down the Shift key.
If a feature is selected, the points on that feature will be listed
in order along the feature.
Note: If no points are selected in the Plan
window, all points on the plan will be listed.
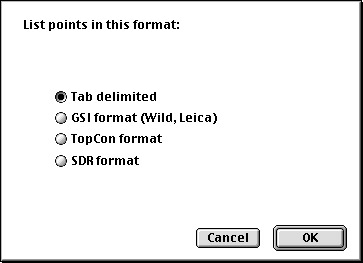
Select List Points from the Text menu. A dialog box as shown in
Figure 20-22
will appear. Choose the format you require to suit upload to
various data loggers. GSI (Wild, Leica), TOPCON and SDR (Sokkisha,
Sokkia).
Note: The formats Tab delimited, SGI and SDR all
list one point per line. TOPCON uses a less readable, but more
compact format. The tab delimited format may be suitable for use with
some data loggers. Points on a feature currently list only in Tab
delimited or TOPCON format.
Figure
20-22
Click OK. The points listed in the text window are ready for
upload.
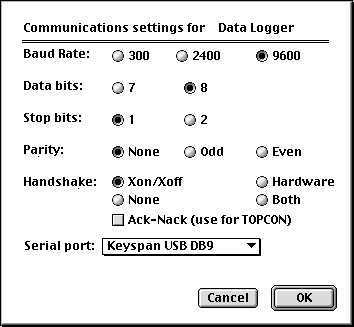
Exporting to a data logger
Choose Upload to datalogger from the Text menu. A dialog box will
appear which allows you to select the communication settings on your
computer that match your data logger (see
Figure 20-23 ) Select the appropriate
serial port from the from the pop-up menu. There is also a check box
to enable Ack-Nack protocol for use with TOPCON devices.
Note: Some data loggers and instruments can
accept PC Memory Cards (sometimes known as PCMCIA cards). To upload
data to such dataloggers the text file should be saved, and copied
onto the PC card. Many notebook computers are fitted with PC card
slots, and others can be fitted with external PC card readers. Some
computers do not have built-in serial ports. Add-on serial ports are
available and you can also connect via USB connectors, PCI slots, or
PC card slots. For serial ports added in this manner, proceed as
outlined above. Individual manufacturers supply the necessary drivers
for their serial port.
Figure
20-23
Click OK and the data logger should be ready to accept data. If no
response is received on the serial port after 90 seconds, the upload
is abandoned.
| Previous |
Next |