|Creative Engineering
home page|
|Table of contents |
Learning HighRoad |
Using HighRoad|
Reference|
| Previous |
Next |
Chapter 14
Quantities
This chapter shows you how to calculate earthworks
quantities and display them on the screen or in a text file. HighRoad
calculates earthworks quantities using the end-area method allowing
for bulking or compaction and horizontal curvature. Cut and fill
volumes are calculated between the existing surface (after any
stripping) and the underside of the finished surface layers. HighRoad
also calculates cut and/or fill volume between the terrain surface
and a datum plane.
Earthworks
quantities

HighRoad will calculate earthworks quantities when the Schedule of
Quantities window is open and the range over which the quantities are
required is specified. Stripping will be calculated in conjunction
with earthworks quantities if a depth of stripping is specified.
You can access quantities calculations in both the Schedule of
Quantities window and the Text window. When the Text window is
active, quantities can be listed in this window and saved as a text
file. See Listing
quantities for details.
Overlapping control lines
Where you want to design control lines that overlap, you need to
consider how you will handle the quantities calculation in the area
where the control lines overlap. We recommend that you use the option
to construct control lines. (See
Constructing the
road) HighRoad will create a terrain model based on the finished
surface of the design after construction. Design the first control
line, construct it and then design the next. This will allow you to
calculate quantities more precisely when you have designed control
lines which overlap. If you do not use the option to construct the
road then you will need to interpret the quantities produced by
HighRoad in areas where control lines (and their batter slopes)
overlap.
Schedule of Quantities
Choose Schedule of Quantities... from the Window menu. If the
chainages between which the quantities will be calculated are
specified, a schedule of quantities will be displayed and will list
the following items:
* Cut to fill
* Cut to spoil / Borrow to fill
* Stripping to stockpile (if chosen from the Quantities menu)
If you have created an additional strata (such as rock), HighRoad
will list the items for each strata. You can specify a compaction or
bulking factor to be taken into account for each stratum when
calculating the amount of cut to fill and cut to spoil or borrow to
fill.
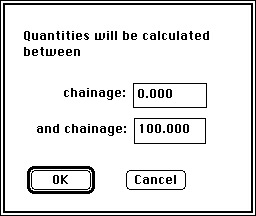
Quantities limits
To specify the chainage range, choose Limits... from the
Quantities menu, or Quantities limits from the Text window. A dialog
box (see Figure 14-1) will appear and you
can type the chainages between which the quantities will be
calculated.
Figure 14-1
For final quantities, be sure to specify the start and finish of
the section of road which is to be constructed. During design, you
may find it useful to limit the calculations to a smaller chainage
range so that the calculation of the quantities is faster. If you
limit the quantities calculations to the area in which you are
adjusting the design, you can still see how your changes are
affecting the quantities without having to wait to calculate the
whole length of road.
Stripping
HighRoad can allow for stripping of a topsoil layer prior to
calculating the cut and fill volumes. The volume of material stripped
is calculated and listed as Stripping to stockpile in the schedule of
quantities. HighRoad is initially set up for a strip depth of 100 mm.
You can change this depth. Select No stripping... from the Quantities
menu. A dialog box will appear and you can enter the depth of
stripping you require. If a strip depth has already been specified
the menu item will be Strip depth <>mm...
Compaction or bulking
factor
Most natural material excavated from a cutting will occupy a
different volume when it is compacted in fill. This volume change can
be specified as a compaction or bulking factor. To specify this
factor, choose Earthworks factor... from the Quantities menu. If the
material occupies a smaller volume in the fill than in its natural
state, specify a compaction factor (for example, 10%). If the reverse
is true, specify a bulking factor. This factor is taken into account
when calculating a schedule of quantities and when displaying balance
levels. If you have created more than one stratum then you can
specify a different compaction or bulking factor for each stratum.
For more information about compaction or bulking, refer to
Earthworks, page 24-2.
Interval between end areas
The interval between end areas used for quantities calculations
depends on the type of survey data. Where survey data is in the form
of a network of points, the cross sections used for end area
calculations are spaced at the interval specified the dialog box
shown in Figure 10-1. To
specify this interval, choose Layout from the Sections menu. For more
information about Quantities calculation, refer to
Method of calculating
quantities.
Effect of plan curvature on earthworks volumes
The interval between end areas is measured along the control line.
On curves this may not represent the distance between centroids of
cross sections. End areas can adjusted to allow for the effects of
horizontal curvature. Choose Method of calculation... from the
Quantities menu and Text menu. A dialog box as shown in
Figure 14-2 will appear. Check the box
labelled Adjust end area using Pappus theorem.
Figure 14-2
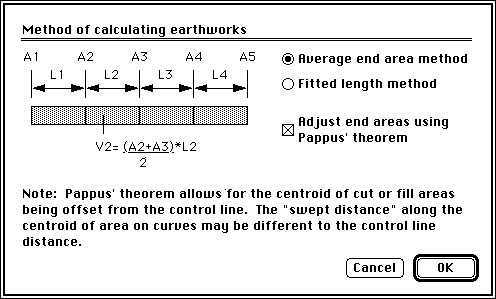
Pappus' theorem is applied using the centroid of the area of cut
and fill of each cross section in relation to the location of the
control line.
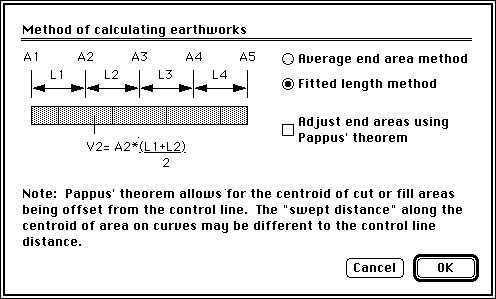
Fitted length method
You can choose to list the quantities using the fitted length
method. Choose Method of calculation... from the Quantities menu and
Text menu. A dialog box as shown in Figure
14-3 will appear. Check the box labelled Fitted length method.
This results in the same total volume but volumes are calculated at
each cross section rather than between cross sections.
Figure 14-3
Printing the quantities
You can print a list of cross section end areas and cut, fill and
stripping volumes for part or all of the design. To print quantities
information, you must first list the quantities in a text file and
then print the text file. Choose Text from the Window menu. An empty
document will be displayed. Set up the quantities limits, strip depth
and the compaction or bulking factor as required from the Text menu.
Choose List Quantities from the Text menu. A dialog box similar to
that shown in Figure 14-4 will appear. You
can choose which items are to be listed. Save the text file in the
usual manner. You can open this text file using a word processor or
spreadsheet and create a report or present it in the required format.
Note: If a Text window is already open (for
example, the original text file of survey points) it will be brought
to the front and become the active window. You can list the
quantities in this window (they will be appended to the end of the
file). Alternatively you can create a new text file. Choose New text
file from File menu.
Figure 14-4
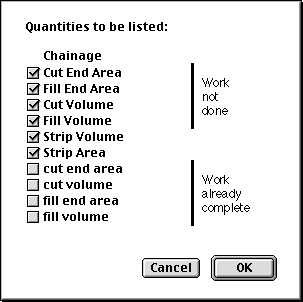
Note: The notation Work not done and Work already
complete will appear if you have created a second DTM to be used for
earthworks monitoring. This feature is useful for producing
quantities of work done on a regular basis, such as monthly
quantities for a road construction contract. For more information see
Monitoring construction
quantities, below.
Monitoring construction
quantities

Note: This option is available only if you have
purchased the license to use the Extra DTM module. This module is
included in HighRoad Pro and optional in the other models.
During construction of a project designed with HighRoad you can
monitor the progress of the project by measuring quantities of
earthworks completed, compared with quantities of work yet to be
done.
To monitor the progress of the work HighRoad needs information
about the original ground model and progressive information about
changes to that ground model as work proceeds. The original ground
model is used for the design and it is called Existing Surface DTM.
The new DTM that represents the changing surface of the ground during
construction will be named by you and will start off being identical
to the original ground. This will be referred to as the Progress DTM.
As work progresses new survey information is added each month (or
whatever cycle suits your project) to the Progress DTM. As work
progresses, the Progress DTM differs increasingly from the original
DTM as more new survey data is added. At any time earthworks
quantities can be listed and these will show a snapshot of the
project at that particular time.
Creating the Progress DTM
It is important that roads or pads have not been constructed if
you wish to monitor the progress of a project. The DTM must represent
the original ground surface before the project commenced. Choose Save
as... from the File menu. Name appropriately , for example <My
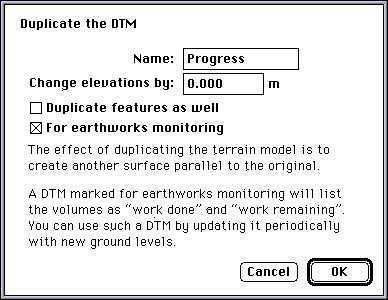
project progress claim 1>. Choose Duplicate DTM from the Edit menu
to duplicate the existing ground. A dialog box as shown in
Figure 14-5 will appear. The elevation
should not be changed. Make sure that it is zero. Check the box
marked For earthworks monitoring. Features, especially breakline
features, are usually inappropriate for construction monitoring, so
you will not need to check the box labelled Duplicate the features as
well.
Updating the Progress DTM
Update the Progress DTM with new survey data to show the state of
construction. Firstly prepare a list of new survey data points .
Note: When preparing a list of points of the new
work to be added to the Progress DTM, choose suitable descriptions
for points so that they can be identified later, or can be
automatically joined by features defined in the feature library.
Figure 14-5
Select the Progress DTM from the Active menu. Choose Text from the
Window menu. A blank Text window will appear. Choose Open Text
File... from File menu. A standard file dialog box will appear. Open
the text file containing the new points. Choose Convert text file...
from the Edit menu. The new points will be added to the Progress DTM.
Delete or make non-contourable any old points within the area
where new points were added. Choose Contours... from the Design menu
to specify contour interval and tension. Click OK. The contours on
the Progress DTM are shown in blue to differentiate from the green
used for the original DTM. The Progress DTM should show the state of
construction at the time of the new survey data.
Choose Text from the Window menu to display a Text window. Choose
List quantities from the Text menu. A dialog box similar to that
shown in Figure 14-4 will appear. You can
choose which items are to be listed of the work that has been
constructed, and the work still remaining.
Each time you wish to process a new claim, make a copy of the
current file (in this case, My project progress claim 1) and save it
under a new name (in this case, My project progress claim 2).
Progressive addition of survey data will mean the main project file
used for monitoring progress will show only the latest construction
surface.
Balanced
earthworks

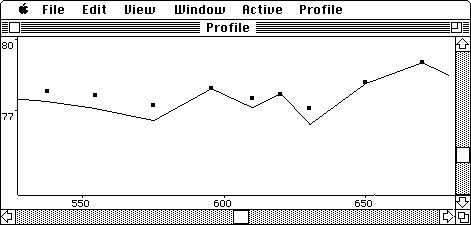
It is often a design objective to have balanced cut and fill
quantities. HighRoad will calculate the level for each cross section
which will produce a balance of cut and fill. The level at which this
ratio is achieved is shown as a square marker as in
Figure 14-6. (The natural surface is also
shown.) These points can be used as a guide when positioning the
grade line. Minimum earthworks would result if the grade line passed
through each point.
HighRoad will calculate and display balance levels for a profile
whenever there is survey information and a typical section for the
length of the profile. Choose Profile from the Window menu. Choose
Show balance levels from the Profile menu. A tick will appear beside
this item when it is selected. HighRoad will calculate the level
which will produce close to a balance of cut and fill for each cross
section. The maximum deviation of cut and fill will be no more than
5% and in most cases, the level calculated will produce a balance to
within 1%.
Figure 14-6
When you first select the item there will be a delay while the
levels are calculated (the watch cursor will appear on the screen).
HighRoad will recalculate the balance levels whenever you change the
typical section data. Each time HighRoad recalculates the levels the
watch cursor will appear. Design the gradeline for the road as usual
using the balance levels as a guide. You can specify a compaction or
bulking factor to be used when calculating earthworks balance levels.
(For further information see page
14-3, Compaction or bulking
factor.)
Full bench
construction

In rugged terrain it is often a design objective to have the road
fully in cut, rather than having a balance of cut and fill. This is
called full bench construction and HighRoad will calculate levels at
which there is no fill, and display these levels on the profile as a
square marker. This works in a similar manner to balance levels
above. This is done by progressively lowering the cross section until
no fill is present. This is approximate only but gives a good guide
for a first trial gradeline. To use this option, choose Full Bench
Levels from the Profile menu.
Mass haul
diagram

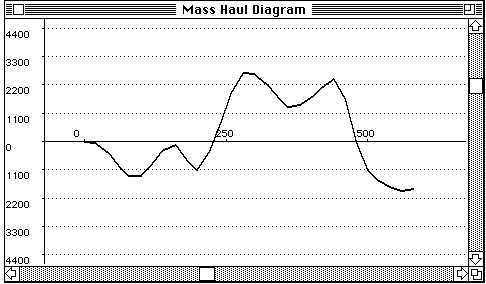
This feature is used as an aid to minimising construction costs.
The mass haul diagram shows the cumulative fill volume plotted
against chainage along the road. The compaction (or bulking) factor
is used in calculating the cumulative fill volume. Fill volumes are
shown above the x-axis and cut volumes are shown below. The mass haul
diagram is plotted between the quantities limits that you have
chosen. A typical mass haul diagram is shown in
Figure 14-7.
Viewing the mass haul diagram
First choose Quantities from the Window menu, then set the
quantities limits by Limits... from the Quantities menu. Check the
compaction factor by choosing Compaction Factor... from the
Quantities menu. Choose Mass Haul Diagram from the Window menu. The
earthworks quantities will be calculated and the mass haul diagram
plotted between the quantities limits.
Figure 14-7
Change the horizontal scale of the mass haul diagram
by choosing the appropriate scale from the View menu. You can make
arbitrary adjustments to the vertical scale by using the vertical
scroll bar. As the scroll box is moved towards the bottom of the
window, the vertical scale is reduced. The mass haul diagram uses the
same horizontal scale and horizontal scroll bar position as the
Profile window. If both windows are visible the contents of both
windows will change together as you scroll and change scales. If you
adjust the finished surface profile, the mass diagram will be
recalculated and redrawn to suit.
Printing the mass haul diagram
When the Mass Haul Diagram window is the front window you can
print the diagram. Choose Print Mass Diagram... from the File menu.
The diagram will be printed with the horizontal axis centred on the
page.
Using the mass haul diagram
The mass haul diagram provides an indication of the haul distances
involved in a particular job. With roads of substantial length it may
not be sufficient to simply achieve a balance of cut and fill
volumes. It is also important to ensure that haul distances are
minimised. The cut and fill volumes are balanced between points where
the diagram crosses the x-axis. In general, the more often the plot
crosses the x-axis, the lower the haul distances. You can examine the
mass haul diagram, adjust the design profile or typical sections,
then review the total quantities and mass haul diagram to see the
effects of these design changes.
Volume to a
datum

Cut and/or fill volume between the terrain surface and a datum,
and within a defined area can be calculated. To define the area
within which the calculations are to be made use a special feature
string called Volume boundary. This feature must be joined, and
closed, and contourable.
Non-contourable or non-breakline features
To calculate volumes HighRoad calculates the volume of each
triangle. Therefore the earthworks boundary must be made up of
triangle sides. If the feature is on non-contourable points, or is
not a breakline it will probably cross over triangle sides. To
calculate volumes for such a feature HighRoad will have to adjust the
triangles to match the volume boundary. In the case of a
non-contourable feature, HighRoad first has to make the boundary
vertex points contourable. This has to be done without changing the
shape of the terrain so the vertex points have to be set at ground
level. HighRoad calculates the ground level at the vertex location,
sets the elevation of the vertex to ground level, then makes the
point contourable and incorporates it into the triangulation.
For non-breakline features, new points have to be created wherever
the feature line intersects a triangle edge. These points are also
given an elevation equal to the ground level at this point to ensure
that the shape of the terrain is not changed by this process.
After both these steps are done, the earthworks boundary now lies
along triangle edges and the volumes can now be calculated.
Warning: Because the triangulation may be
adjusted to meet these requirements you should save your project as
another name before doing volume calculations. You can then always go
back to the earlier version with the original triangulation.
Calculating volumes
The calculations are done and listed in the Text window. To begin
you must make a new feature and mark it as a volume boundary feature.
(You can also change an existing feature to be used as an volume
boundary). Choose New feature string... from the Plan menu. A dialog
box as shown in Figure
4-10 will appear. Select Volume boundary from the pop-up menu in
the feature dialog box and create the new feature.
Switch to the Text window, select Datum plane for volumes... from
the Text menu and set the volume datum. You can change the size of
the Text window so it is small and the Plan window is visible behind
it. In this way, as the calculations are done the triangles that were
used for the calculations will be visible on the Plan view. Choose
Volume to plane calculations from the Text menu. The volumes will be
calculated and listed in the Text window.
You can create more than one volume feature in each project. Each
volume feature used in the calculations will be listed.
Warning: There are some limitations to this
simple method of earthworks calculations. The volume of each triangle
is calculated by using its average height. This will produce an
incorrect result if the datum level is not completely above or
completely below all points within the earthworks boundary. In the
case of a triangle with points both above and below the datum, its
volume will be calculated as the net cut or fill for that triangle.
For example if its volume is made up of 12 m3 of fill and 5 m3 of
cut, it would be listed as 7 m3 of fill. Triangles completely above
or below the datum will be calculated correctly.
| Previous |
Next |