|Creative Engineering
home page|
|Table of contents |
Learning HighRoad |
Using HighRoad|
Reference|
| Previous |
Next |
Chapter 19
Plotting
This chapter shows you how to produce plotted drawings
using HighRoad. You will learn how to interface your computer with a
plotter and how to set up the layout of the plotted drawing.
Connecting a
plotter

You can plot drawings on Hewlett-Packard or Houston Instrument
plotters (or other plotters which emulate these plotters using the
graphics languages HPGL and DMPL) Select Choose Plotter... from the
File menu to tell HighRoad which plotter you have connected to your
computer. A dialog box will appear in which you can select the
appropriate plotter. Once you have chosen your plotter, HighRoad will
remember this.
You should connect the plotter to the modem port of your computer.
Plotting from the printer port is not currently available. HighRoad
expects the plotter to be set up to communicate in accordance with
the following protocol.
Houston Instrument
Baud Rate 2400
Data Bits 7
Stop bits 2
Parity None
These are the default values used by a DMP-42 plotter at start-up.
Hewlett-Packard
Baud Rate 9600
Parity checking Off
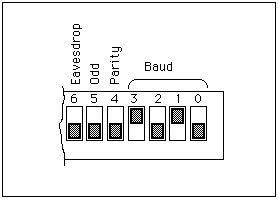
For the HP DraftPro plotter, make sure the plotters rear-panel
switches are set as shown in Figure 19-1.
Figure 19-1
Changing the communication settings
If you wish to use different settings to communicate with your
plotter, choose Communication Settings... from the Edit menu. A
dialog box as shown in Figure 19-2 will
appear.
Figure 19-2
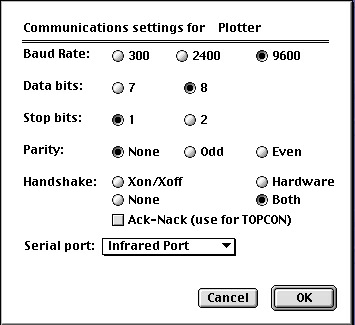
Use this dialog box to adjust the settings used by HighRoad to
match the settings on your plotter. Click on the serial port pop-up
list to select the type of serial port you have on your computer.
(See the note
regarding serial ports.)
Plotting the
plan

The plan can be plotted when the Plan window is the active window.
(Choose Plan from the Window menu.) Contours, triangles and feature
strings may be shown in addition to the plan of the road. Choose Show
contours, Show triangulation, Show features as required from the Plan
menu.
Select Plot Plan... from the File menu. A dialog box will appear
as shown in Figure 19-3. The name of the
plotter you have chosen will appear in the top left hand side of the
dialog box.
Figure
19-3
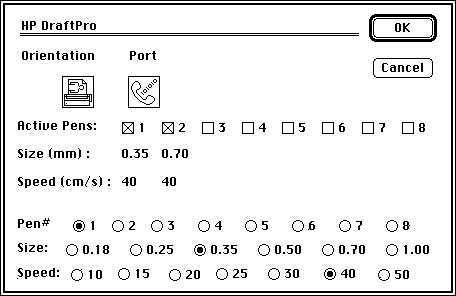
Pen sizes and speeds
HighRoad will use 0.18mm, 0.35mm, and 0.70mm pens if available.
The pens can be placed in any pen stall and can be set to plot at
whatever speed is appropriate. The best speed at which to plot
depends on the types of pen and plotting media you are using. You
should consult your plotter manual and/or pen data sheet for this
information. Click the appropriate boxes to select the pen size and
speed.
For example, to plot with a 0.35 mm pen in stall 1 at 40 cm/sec
and a 0.70 mm pen in stall 2 at 40 cm/sec you would need to complete
the following steps:
* Click pen numbers 1 and 2 in the row marked Active
Pens to show which pens are active. (Ensure that no other pens are
shown as active.)
* Click pen number 1 in the row labelled Pen# and then click the
appropriate button for size and speed.
* Click pen number 2 and the appropriate button for size and
speed.
The dialog box should look similar to Figure
19-3.
Plotting the plan
Once you have selected the pen size and speed required, click OK.
The following dialog box will appear. You can choose to show a north
point, border, curve data, grid and right of way on the plan.
Figure 19-4
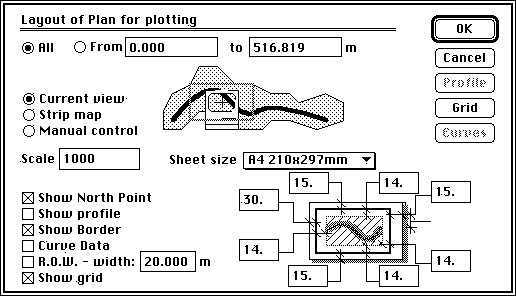
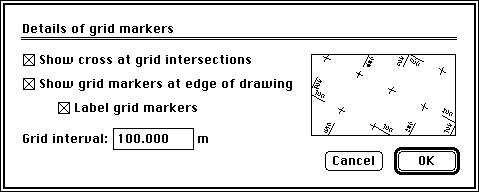
When the Grid option is checked, the Grid button will be active.
Click the Grid button. A dialog box, as shown in
Figure 19-5 will appear and you can specify
the spacing and labelling of the co-ordinate grid system.
The grid can be shown using crosses at grid intersections and/or
where the grid lines cross the edge of the drawings. The grid markers
can be labelled.
Figure 19-5
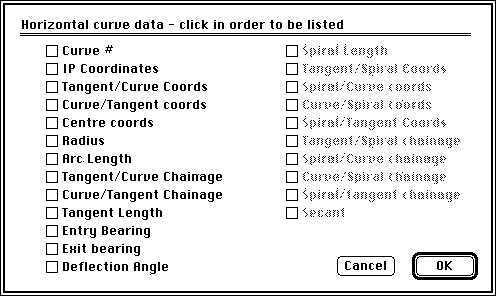
When the Curve Data option is checked, the Curve Data button will
be active. Click the Curve Data button and the plan layout dialog box
as shown in Figure 19-6 will appear. You
can select the horizontal curve data (radius, arc length, spiral
length, co-ordinates etc) which will be listed on Plan view. Items
are listed in the order you choose and a box is drawn around these
items.
Figure 19-6
When the Right of Way (R.O.W.) option is checked, the R.O.W. will
be drawn on the plan. The R.O.W. width that you specify will only be
used if it is larger than the width between the batters plus 3
metres. If not HighRoad will use the width between the batters plus 3
metres.
The Current View option (shown in Figure
19-4 previously) will position the plan on the drawing sheet such
that the point which is in the centre of the screen will be in the
centre of the drawing. It will be clipped according to the margin
settings that you select.
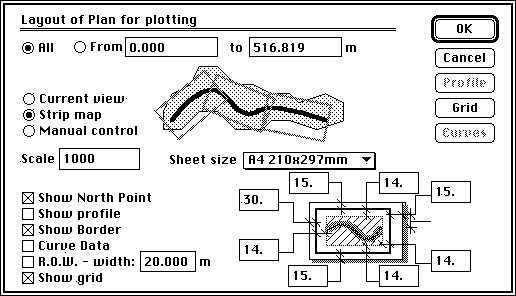
The Strip Map option (shown in Figure
19-7) will rotate the Plan view so that it is generally running
from left to right across the sheet.
When the Strip Map option is chosen you can also plot the profile
along the bottom of the drawing. When Show Profile is checked, the
profile button is enabled and the diagram in the lower right of the
dialog box shows the plan and profile and the proportion occupied by
the plan. You can nominate the proportion of the drawing occupied by
the plan. To set the options for the profile, click the Profile
button. A dialog box as shown in Figure
19-10 will appear. Click OK or Cancel and HighRoad will return to
the Plan layout dialog box. As many sheets as required will be used
to produce the drawings.
Figure 19-7
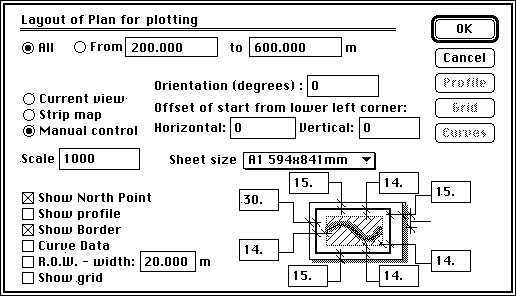
The Manual control (see Figure 19-8)
allows you to choose the scale and orientation of the plot.
Orientation is the direction of the north point on the sheet zero is
north up, 90 is north to the right, and so on. The plan will be
rotated about the start point.
Figure 19-8
Plotting
Click OK when you have selected the required layout. HighRoad will
test communications with the plotter and if the plotter is connected
correctly the message Please insert the next sheet in the plotter
will appear. Click OK and plotting will commence after a short delay
while HighRoad positions the plot on the sheet.
Plotting the
profile

The profile can be plotted when the Profile window is the front
window. Choose Plot Profile... from the File menu when you are ready
to plot. A dialog box will appear as shown in
Figure 19-9. The name of the plotter you
have chosen will appear in the top left hand side of the dialog box.
Pen sizes and speeds
HighRoad will use a 0.35 mm and a 0.70 mm pen if available. The
pens can be placed in any pen stall and can be set to plot at
whatever speed is appropriate. The best speed at which to plot
depends on the types of pen and plotting media you are using. You
should consult your plotter manual and/or pen data sheet for this
information.
Click the appropriate boxes to select the pen size and speed. For
example, to plot with a 0.35 mm pen in stall 1 at 40 cm/sec and a
0.70 mm pen in stall 2 at 40 cm/sec you would need to complete the
following steps:
* Click pen numbers 1 and 2 in the row marked Active
Pens to show which pens are active. (Ensure that no other pens are
shown as active.)
* Click pen number 1 in the row labelled Pen# and then click the
appropriate button for size and speed.
* Click pen number 2 and select pen size and speed as above.
The dialog box should look similar to Figure
19-9.
Figure 19-9

Profile plot
Once you have selected the pen size and speed required, click OK.
A dialog box as shown in Figure 19-10 will
appear. You can select the scale, vertical exaggeration, drawing
size, format and how to display the natural surface information.
Plotting the profile
Frequently with a terrain model, the natural surface information
on the drawing of the profile can be very cluttered if the elevation
at every change of grade is displayed. You can minimise this clutter
by limiting the number of points which have an elevation displayed.
You can choose to show elevations only at the cross section interval
or only opposite points on a particular feature. This would be useful
if you have a pegged line which closely parallels the control line
and you wish to display elevations at chainages opposite points on
this pegged line. The pegged line has to be a named feature which you
can then choose from the pop-up menu in the dialog box as shown in
Figure 19-10.
Figure
19-10
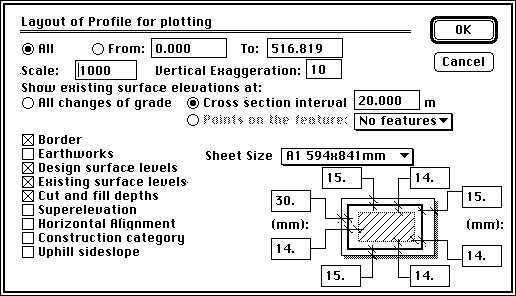
Uphill sideslope will include an entry for slope on the uphill
side of the cross section, from the natural surface at road centre
line to the natural surface at the batter point.
The Superelevation option (which is available only if
superelevation has been specified for this control line) will display
a superelevation diagram along the base of the profile.
The Horizontal Alignment option will display a diagrammatic
representation of the horizontal alignment along the base of the
profile. The Cut and fill depths option will include an entry for the
cut depth or fill height at the control line.
Plotting cross sections

Cross sections can be plotted when the Cross Section plot window
is the front window. To specify the layout of the cross sections,
choose Layout... from the Section menu. A dialog box will appear as
shown in Figure 19-11.
Figure
19-11
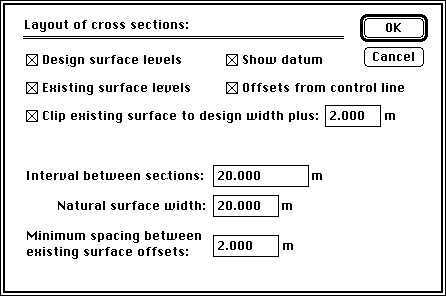
Layout of cross sections
The top four check boxes are used to select how much information
is to be displayed on each cross section. In this example, the cross
sections would include the natural surface levels, the finished
surface levels, the offsets to these points and the level of the
datum line.
The option to clip the width of the existing surface is useful to
minimise the space taken up on plotted and printed drawings by
showing only the natural surface within the design width. Any part of
the natural surface outside the limits of the batter points is
removed. Space savings can be worthwhile when the surveyed cross
sections are significantly wider than the width of the finished
surface. The option for setting the minimum spacing between natural
surface offsets is useful to minimise clutter on a cross section
drawing. Set this to zero if you wish to display the offset and
elevation at every change of grade on the existing surface.
You can plot cross sections in sequence or individually at
specific chainages. Choose Plot Cross Sections... from the
File menu when you are ready to plot the cross sections. A dialog box
will appear as shown in Figure 19-12. The
name of the plotter you have chosen will appear in the top left hand
side of the dialog box.
Figure
19-12

Pen sizes and speeds
HighRoad will use a 0.35 mm and a 0.70 mm pen if available. The
pens can be placed in any pen stall and can be set to plot at
whatever speed is appropriate. The best speed at which to plot
depends on the types of pen and plotting media you are using. You
should consult your plotter manual and/or pen data sheet for this
information.
Click the appropriate boxes to select the pen size and speed. For
example, to plot with a 0.35 mm pen in stall 1 at 40 cm/sec and a
0.70 mm pen in stall 2 at 40 cm/sec you would need to complete the
following steps:
* Click pen numbers 1 and 2 in the row marked Active
Pens to show which pens are active. (Ensure that no other pens are
shown as active.)
* Click pen number 1 in the row labelled Pen# and then click the
appropriate button for size and speed.
* Click pen number 2 and the appropriate button for size and
speed.
The dialog box should look similar to Figure
19-12.
Cross section plot
Once you have selected the pen size and speed required, click OK.
A dialog box, as shown in Figure 19-13 will
appear.
Figure
19-13
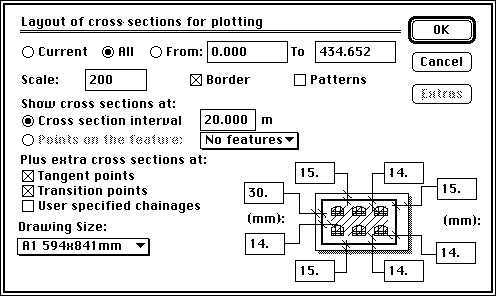
Enter the chainage range of the cross sections you
wish to plot in the appropriate boxes. You can also specify the
spacing between sections. The interval between plotted cross sections
can be either at a nominated interval or at locations opposite points
on a pegged line.
To plot cross sections at points on a pegged line you need to have
nominated the pegged line as a feature string of type Pegged line
(see chapter 4 for
details). The pegged
line must also be approximately parallel to the control line. The
cross sections that will be plotted are those that pass through the
nominated points on the pegged line feature.
Additional cross sections at tangent points, transition points and
at user selected chainages can also be plotted. Sections at tangent
points will have the postscript TC (tangent/curve) and CT
(curve/tangent) and those at transition points will have TS
(tangent/spiral), SC (spiral/curve), CS (curve/spiral), ST
(spiral/tangent), SS (start of superelevation) and ES (end of
superelevation). If User specified chainages is checked, the Extras
button will be enabled. Click Extras and you can add up to 49 extra
cross sections. Type in the chainages of the extra cross sections
that you require. The extra sections will be plotted in the correct
sequence.
You can also specify whether you require the pavements and other
surfaces to be filled with a pattern on the plots of the cross
section. Pattern fills are available only when plotting with a
Hewlett-Packard or HPGL compatible plotter.
The cross sections will be spaced out to fit as many as possible
on the drawing. They will be plotted in columns with their centre
lines aligned and spaced evenly to utilise the vertical space
available. The columns of cross sections will also be spaced evenly
across the sheet. The
Clip to Design
option is useful to minimise the space taken up on plotted drawings
by showing only the natural surface within the design width. Any part
of the natural surface outside the limits of the batter points is not
shown. Significant space savings are achieved in projects where the
surveyed cross sections are much wider than the width of the finished
surface. Choose Cross Sections... from the Layout menu to use this
option.
You can choose to plot a border around the sheet by clicking the
Border check box. Space for a title block at the bottom or side of
the sheet can be allowed for by specifying a wider margin as
appropriate. This is useful when using sheets preprinted with a title
block along the bottom.
Plotting
drawings

When the drawing window is active you can plot a drawing which is
a composite of plan, profile and cross sections as well as lines and
text.
The layout and content of the printed drawing is controlled in the
Drawing window where you have control over the size of the drawing
sheet and its contents. See Chapter 17,
Drawing production for details.
If the drawing is larger than the size of paper in the plotter,
the bottom left corner of the drawing will be matched to the sheet in
the plotter and content that is off the top or right edge of the
sheet will not be plotted.
| Previous |
Next |