|Creative Engineering
home page|
|Table of contents |
Learning HighRoad |
Using HighRoad|
Reference|
| Previous |
Next |
Chapter 18
Printing
This chapter shows you how to print your designs. HighRoad allows
you to print survey data, typical sections, profiles, cross sections,
plans, drawings, schedules of quantities and text files.
Preparing to
print

Printing on Macintosh
Choose the printer you wish to use from the desk accessory
Chooser. For more information on using the Chooser and related
printing matters, consult your Macintosh owner's guide.
Printing on Windows
Choose the printer you wish to use from Printers in Settings in
the Start menu. HighRoad can print direct to Postscript printers. Set
the properties of the postscript printer to Capture printer port. To
allow HighRoad to print to other Windows compatible printers we
recommend you install GNU Ghostscript on your computer. This will
enable you to print to most Windows compatible printers. You must use
Setup-GS.exe to install GNU Ghostscript. Before printing from
HighRoad, choose Page Setup, and if you have installed GhostScript,
choose Win32, and if you are printing direct to a postscript printer,
choose Direct to Port.
Note: GNU Ghostscript (by Free Software
Foundation, Inc.) is made available under the GNU Public License
(GPL). In accordance with the GPL, the source to GNU Ghostscript is
available in the src subdirectory and the license agreement is in the
file copying.txt.
Printing the
plan

The plan can be printed when the Plan window is the active window.
(Choose Plan from the Window menu.) Contours, triangles and feature
strings may be shown in addition to the plan of the road or building
pads.
Printing the plan
Choose Show contours, Show triangulation, Show features as
required from the Plan menu. Select Print Plan... from the File menu.
The following dialog box will appear.
Figure
18-1
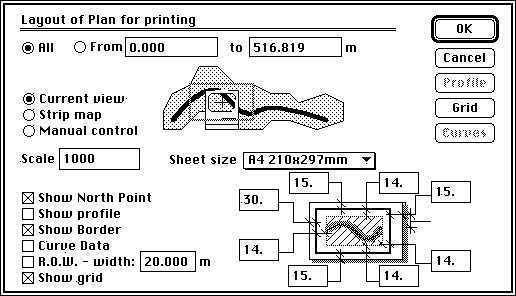
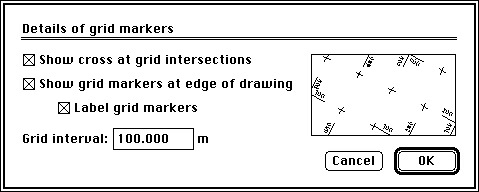
You can choose to show a north point, border, curve data, grid and
right of way on the plan. When the Grid option is checked, the Grid
button will be active. Click the Grid button. A dialog box, as shown
in Figure 18-2 will appear and you can
specify the spacing and labelling of the co-ordinate grid system. The
grid can be shown using crosses at grid intersections and/or where
the grid lines cross the edge of the drawings. The grid markers can
be labelled.
Figure 18-2
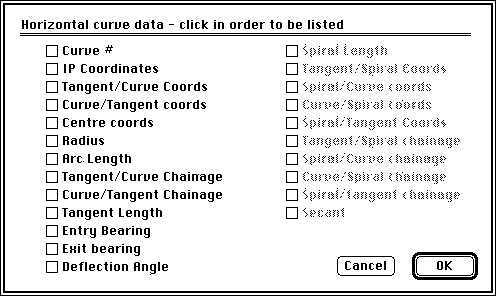
When the Curve Data option is checked, the Curve Data button will
be active. Click the Curve Data button and the plan layout dialog box
as shown in Figure 18-3 will appear. You can
select the horizontal curve data (radius, arc length, spiral length,
co-ordinates etc) which will be listed on Plan view. Items are listed
in the order you choose and a box is drawn around these items.
Figure 18-3
When the Right of Way (R.O.W.) option is checked, the R.O.W. will
be drawn on the plan. The R.O.W. width that you specify will only be
used if it is larger than the width between the batters plus 3
metres. If not HighRoad will use the width between the batters plus 3
metres. The Current View option (shown in Figure
18-1 previously) will position the plan on the drawing sheet such
that the point which is in the centre of the screen will be in the
centre of the drawing. It will be clipped according to the margin
settings that you select.
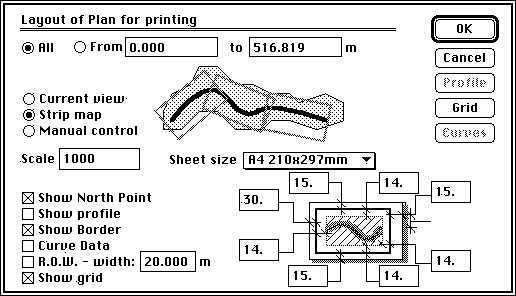
Figure 18-4

The Strip Map option (shown in Figure
18-4) will rotate the plan view so that it is generally running
from left to right across the sheet. When the Strip Map option is
chosen you can also plot the profile along the bottom of the drawing.
When Show Profile is checked, the profile button is enabled and the
diagram in the lower right of the dialog box shows the plan and
profile and the proportion occupied by the plan. You can nominate the
proportion of the drawing occupied by the plan. To set the options
for the profile, click the Profile button. A dialog box as shown in
Figure 18-6 will appear. Click OK or Cancel
and HighRoad will return to the Plan layout dialog box. As many
sheets as required will be used to produce the drawings.
The Manual control (see Figure 18-5)
allows you to choose the origin, scale and orientation of the plot.
Orientation is the direction of the north point on the sheet -- zero
is north up, 90 is north to the right, and so on. The plan will be
rotated about the start point.
Figure 18-5
Printing the
profile

The profile can be printed when the Profile window is the front
window. Before printing choose Page Setup... to select paper size and
orientation. Choose Print Profile... from the File menu when you are
ready to print the profile. The dialog box as shown in
Figure 18-6 will appear. You can select the
scale, vertical exaggeration, drawing size, format and how to display
the natural surface information.
Figure 18-6
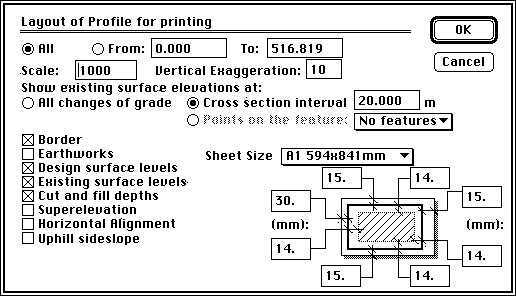
Printing the profile
Frequently the natural surface information on the drawing of the
profile can be very cluttered if the elevation at every change of
grade is displayed. In this case you can minimise this clutter by
limiting the number of points which have an elevation displayed. You
can choose to show elevations only at the cross section interval or
only opposite points on a pegged line. This would be useful if you
have a pegged line which closely parallels the control line and you
wish to display elevations at chainages opposite points on this
pegged line. The pegged line has to be a named feature which you can
then choose from the pop-up menu in the dialog box as shown in
Figure 18-6.
Uphill sideslope will include an entry for slope on the uphill
side of the cross section, from the natural surface at the road
centre line to the natural surface at the batter point. The
Superelevation option (available only if superelevation has been
specified for this control line) will display a superelevation
diagram along the base of the profile. The Horizontal Alignment
option will display a diagrammatic representation of the horizontal
alignment along the base of the profile. The profile will be split
into lengths which fit the drawing sizes chosen.
Printing typical sections

To print a typical section, first bring the typical section window
to the front. Choose the scale at which the typical section will be
printed from the View menu. The typical section currently displayed
will be printed centred on the sheet of paper. Since typical sections
are generally wider than they are high, you may wish to choose
landscape orientation ( ) from the Page
Setup dialog box so that the typical section fits well on the page.
) from the Page
Setup dialog box so that the typical section fits well on the page.
Printing cross sections

Cross sections can be printed when the Cross Section Plot window
is the front window. Before printing Choose Page Setup... to select
paper size and orientation. You can print cross sections in sequence
(at surveyed sections or at a nominated interval) or individually at
specific chainages. The required sections will be printed one to a
page, centred on the page, at the scale selected for the Cross
Section Plot window.
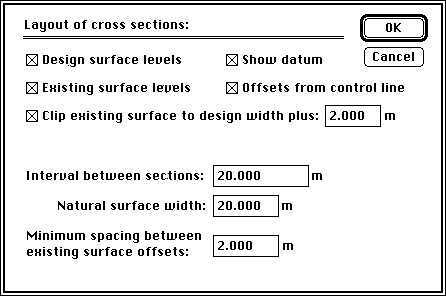
Layout of cross sections
To specify the layout of the cross sections, choose Layout... from
the Section menu. A dialog box will appear as shown in
Figure 18-7. The top four check boxes are
used to select how much information is to be displayed on each cross
section. In this example, the cross sections would include the
natural surface levels, the finished surface levels, the offsets to
these points and the level of the datum line. The option to clip the
width of the existing surface is useful to minimise the space taken
up on plotted and printed drawings by showing only the natural
surface within the design width. Any part of the natural surface
outside the limits of the batter points is not shown. Space savings
can be worthwhile when the surveyed cross sections are significantly
wider than the width of the finished surface. The option for setting
the minimum spacing between natural surface offsets is useful to
minimise clutter on a cross section drawing. Set this to zero if you
wish to display the offset and elevation at every change of grade on
the existing surface.
Figure 18-7
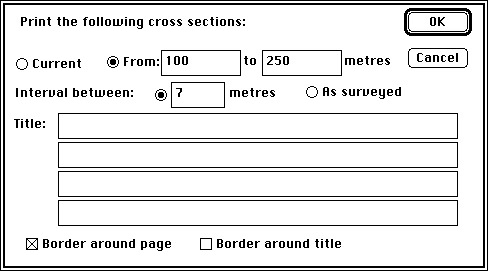
Chainage range
Choose Print Cross Section... from the File menu when you are
ready to print the cross sections. A dialog box, as shown in
Figure 18-8 will appear. The chainage range
for printing cross sections is selected from this dialog box. It is
initially set up to print the cross section currently displayed in
the Cross Section plot window. Enter the chainage range of the cross
sections you wish to print in the appropriate boxes. You can also
specify the spacing between sections.
Figure 18-8
Printing earthworks quantities

You can print a list of cross section end areas and cut, fill and
stripping volumes for part or all of the design. To print quantities
information, you must first list the quantities in a text file and
then print the text file. Choose Text from the Window menu. An empty
document will be displayed. Set up the quantities limits, strip depth
and the compaction or bulking factor as required from the Text menu.
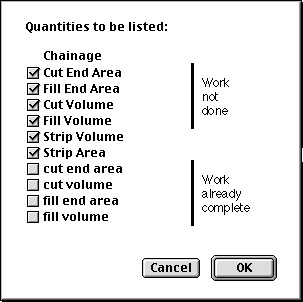
Choose List Quantities from the Text menu. A dialog box similar to
that shown in Figure 18-9 will appear.
Note: The notation "work not done" and "work
already complete" will appear if you have created a second DTM to be
used for earthworks monitoring. This feature is useful for producing
quantities of work done on a regular basis, such as monthly
quantities for a road construction contract. For more information see
Monitoring
construction quantities Chapter 14.
You can choose which items are to be listed. (Quantities for an
additional stratum are only available if you are using HighRoad Pro.)
Save the text file in the usual manner. You can open this text file
using a word processor or spreadsheet and create a report or present
it in the required format.
Figure 18-9
Note: If a text window is already open (for
example, the original text file of survey points) it will be brought
to the front and become the active window. You can list the
quantities in this window (they will be appended to the end of the
file). Alternatively you can open a new text file. Choose New text
file from File menu.
Printing a text
file

You can print a text file when the Text window is in front. Choose
Page Setup... to select the orientation of the page. Then choose
Print text file from the File menu to print this text file. The
content of the text file can be any of the listings that the version
of HighRoad you are using makes (quantities, points, observations,
setting out) and/or any other information you choose to type into
this file.
| Previous |
Next |